Draw It Out: How Drawing Impacts Learning
OCTOBER 16, 2023
Listening, speaking, reading and writing have long been considered the essential foundations of learning. But to improve retention, recall and understanding of complex concepts, help students tap into their artistic side. Research shows that drawing complex concepts produces better results than listening, reading or taking written notes.
Why a Picture Is Worth a Thousand Words
What makes drawing so effective? For one thing, it requires a much higher degree of engagement than traditional notetaking. Students can take notes with very little engagement or understanding by simply writing down some of the words they hear or read. Ideally, they will put the most important words in a lecture or reading passage into their notes. But simply writing down key words does not mean that students have truly understood a concept or that their notes will make sense to them when they look at them later.
Drawing, on the other hand, requires students to actively engage with concepts in a holistic way. Rather than just grabbing words that seem important, students must consider how ideas relate to each other and how to represent complex concepts visually. This requires deeper thinking and engagement that translates to higher levels of understanding, retention and recall.
Research backs this up. A 2018 study by Wammes, Meade and Fernandes showed that students who drew information were able to recall almost twice as much compared to students who wrote notes in words alone. The researchers concluded that drawing is “an effective and reliable encoding strategy, far superior to writing.”
Additional studies have backed this up in disciplines ranging from engineering to anatomy to Chinese poetry. Time and again, drawing has proven to improve motivation, engagement, comprehension, short-term recall and long-term retention.
In addition to activating higher-order thinking, drawing enhances encoding by engaging the brain on multiple levels. Dual coding theory, developed by Allan Paivio in the 1970s, proposes that humans process verbal and visual information through separate yet interconnected channels. Activating both cognitive subsystems—the semantic system and the visual system—results in better understanding and retention than activating either system in isolation. Drawing also adds a third system, the kinesthetic system. Activating all three systems together gives the brain more pathways for successful encoding and understanding.
Research shows that drawing improves learning for all students, regardless of learning style or preferences. And students don’t need to be artists to see the benefits. It is the process itself that improves learning, regardless of artistic ability.
Drawing With Thinking Maps
Students can also tap into the benefits of drawing using Thinking Maps. Thinking Maps is a “visual language for learning” that activates higher-order thinking. Here are some ways you and your students can maximize the learning benefits of drawing using Thinking Maps.
1. Have students draw their own Thinking Maps.
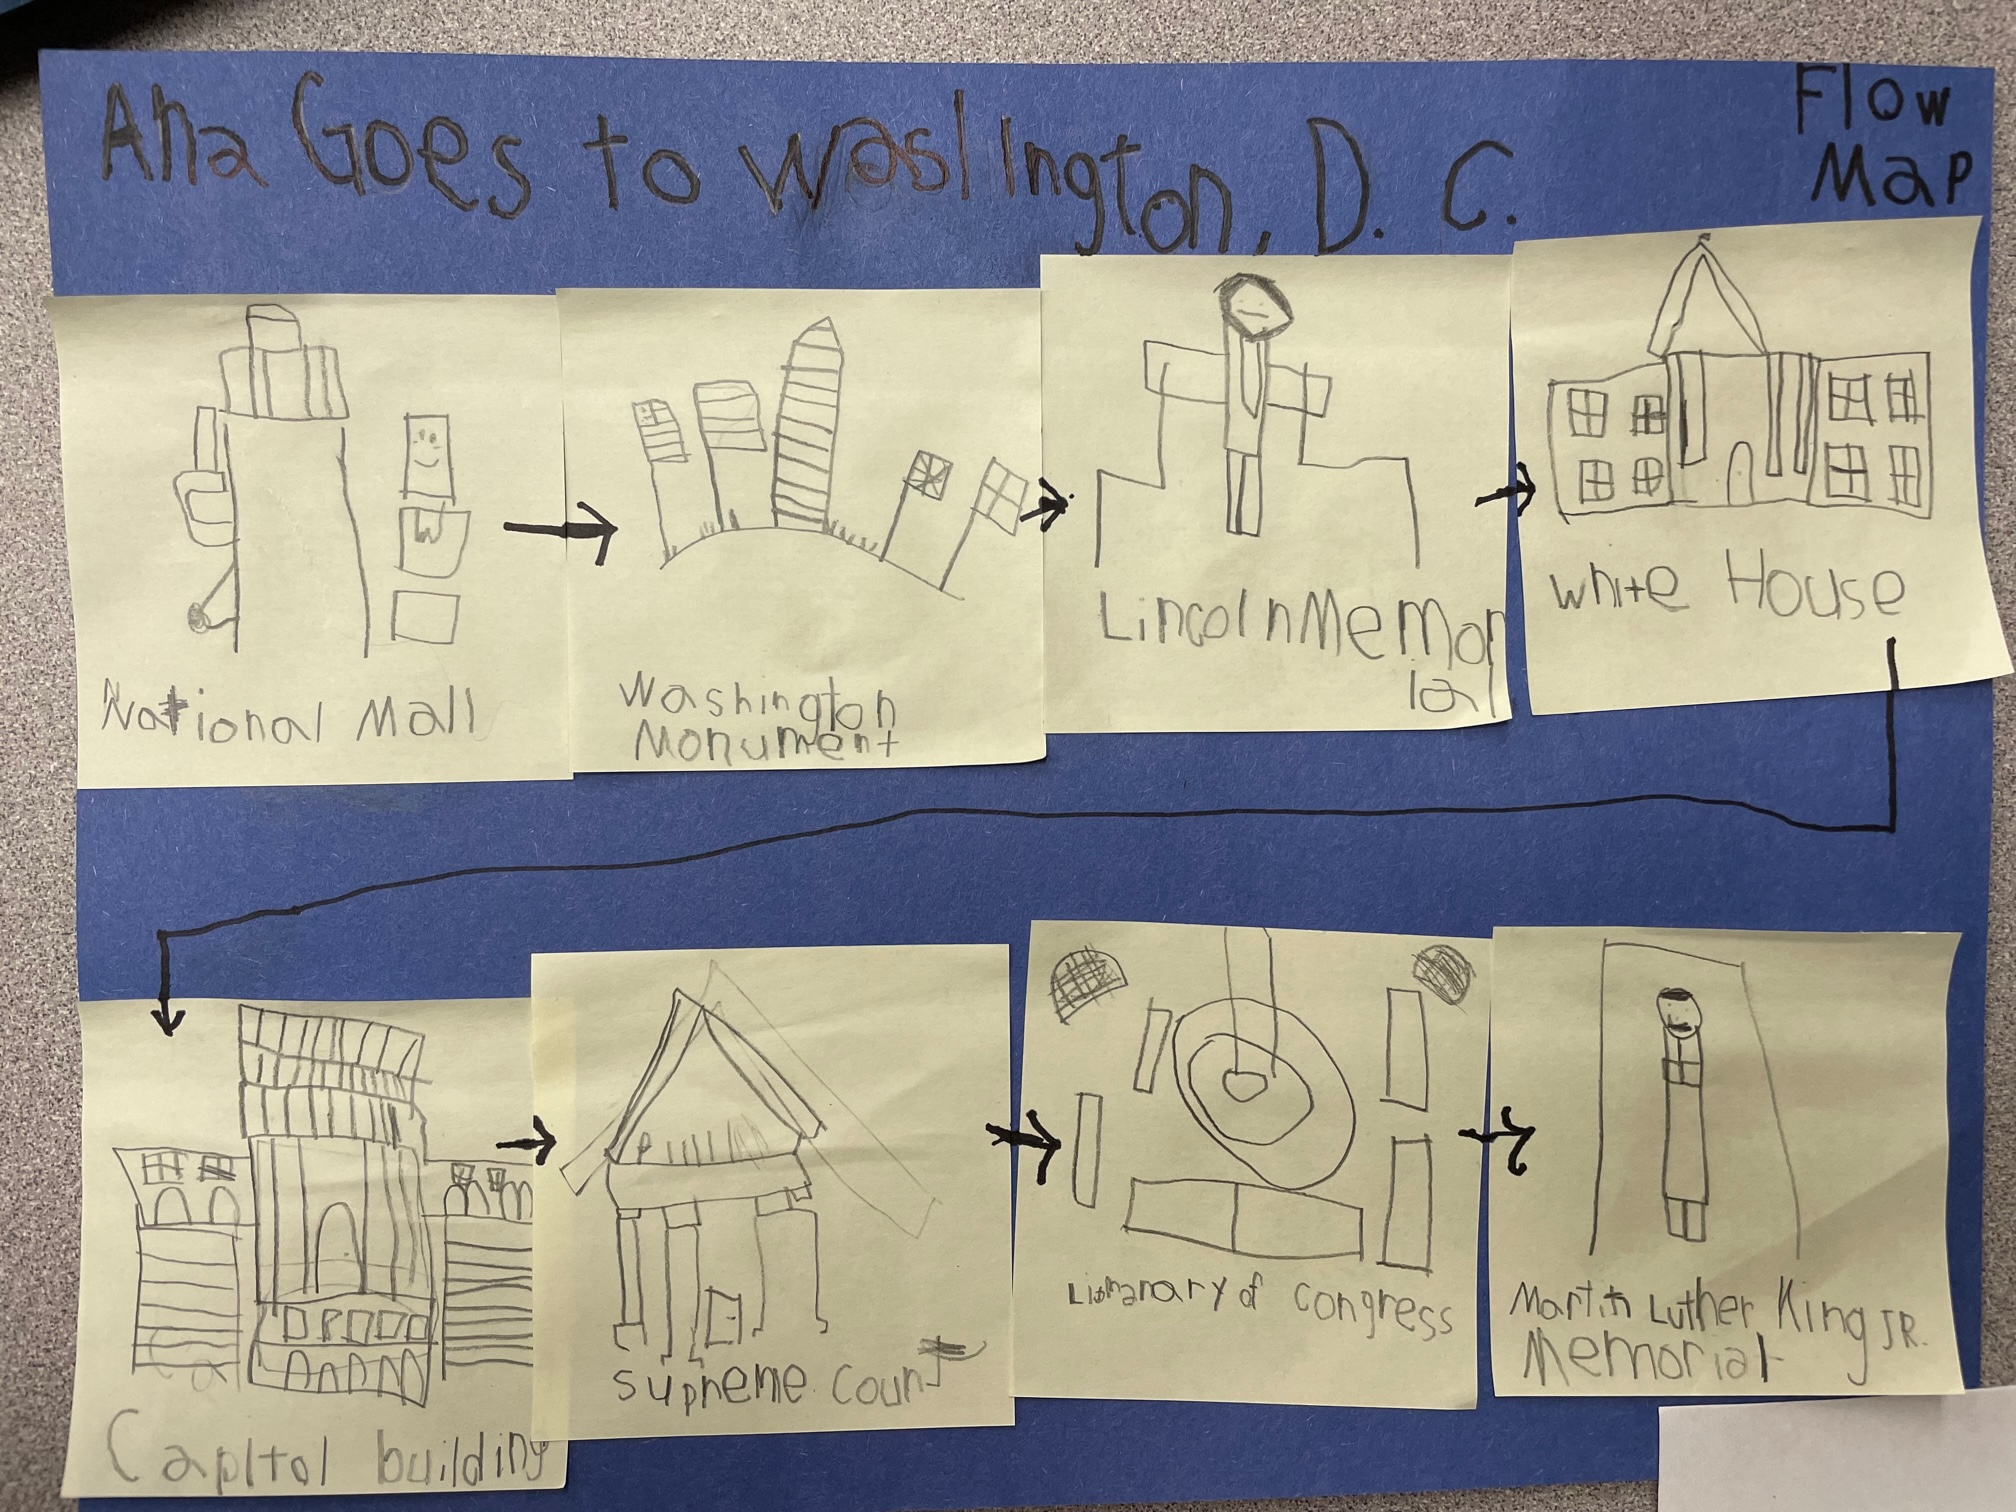
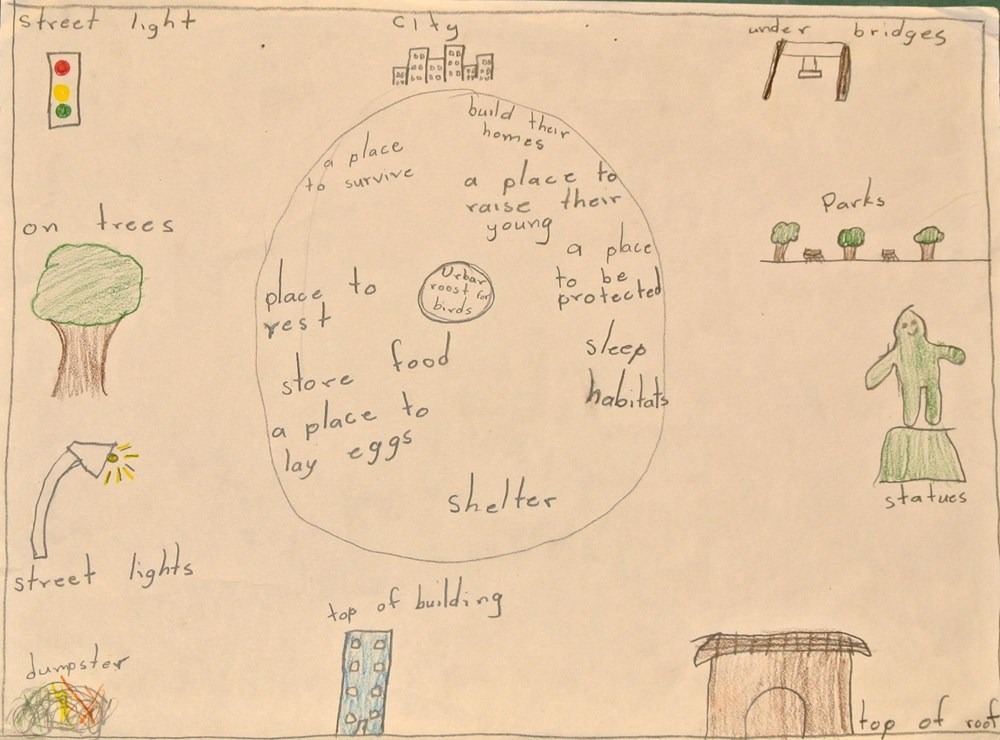
Thinking Maps are a student-directed strategy, not a teacher-directed task. While it may be tempting to give students a blank template for a Thinking Map and have them fill it in, students get the most benefit when they construct their own Maps from scratch. Unlike graphic organizers, which simply ask students to fill in the blanks, Thinking Maps ask students to determine which kinds of thinking are required for the learning task and draw out their Thinking Maps themselves. For example, when classifying things using a Tree Map, students decide for themselves how many branches their Tree should have and how many details go under each branch. The act of determining what their Thinking Maps should look like and drawing them themselves requires students to engage deeply with content in a way that promotes understanding and retention.
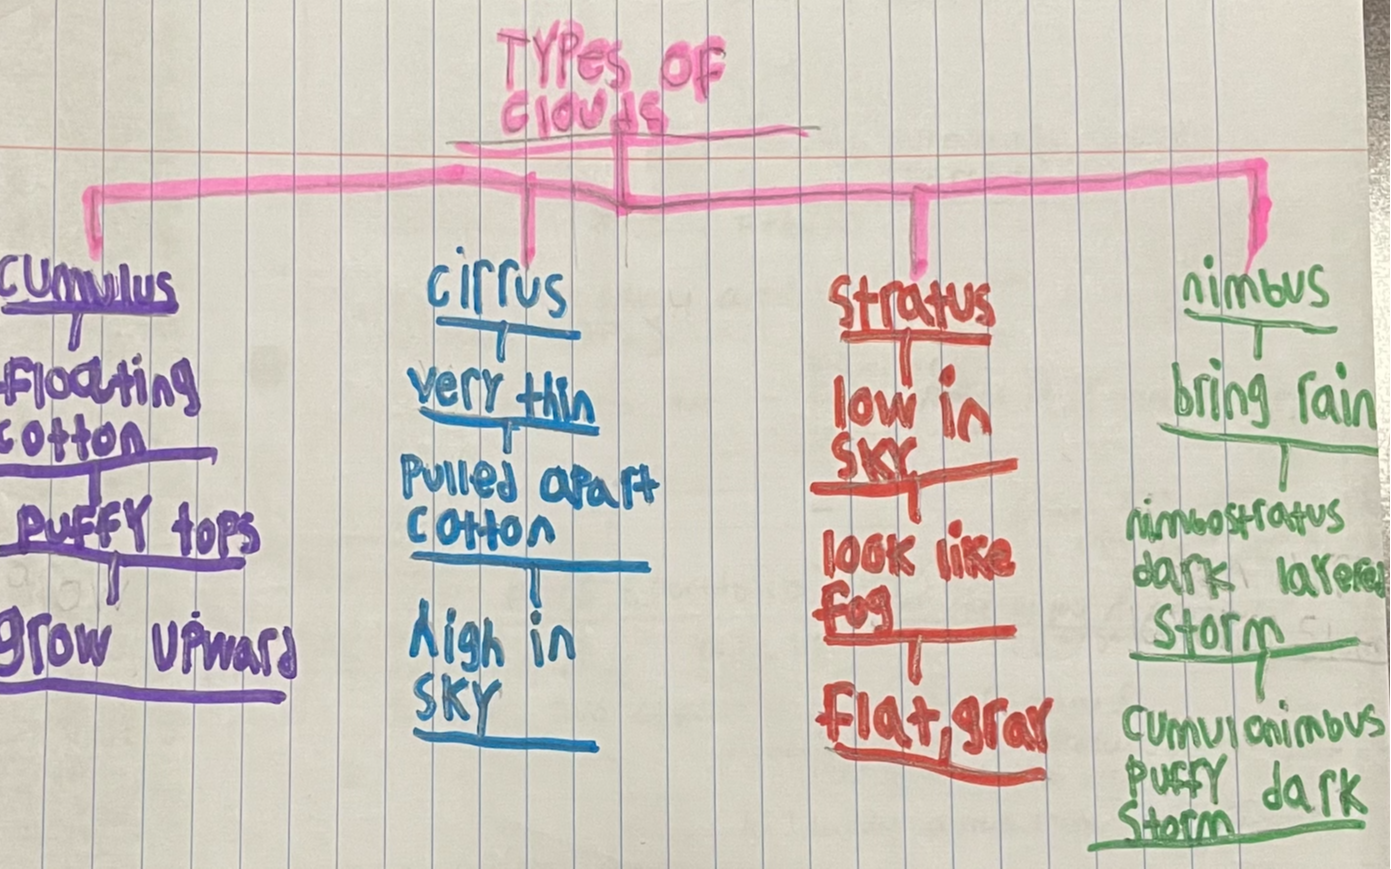
Drawing their own Thinking Maps helps students clarify their understanding of complex topics, from elementary school to high school and beyond.
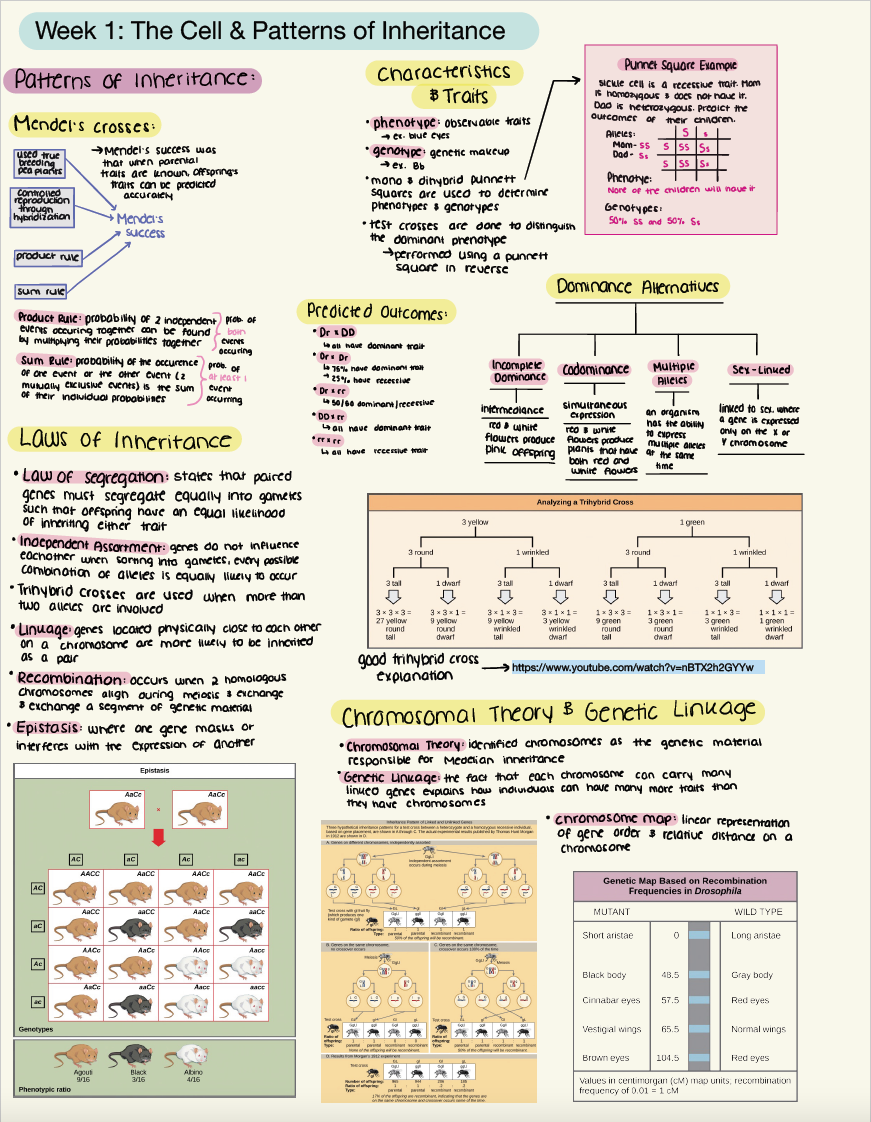
2. Draw Thinking Maps on paper (at least part of the time).
There are a lot of advantages to creating Thinking Maps digitally in Map Builder, part of the Thinking Maps Learning Community (TMLC). Creating digital Thinking Maps is especially valuable for collaborative projects and final products that incorporate multimedia elements and links. But for initial encoding of new ideas, creating Thinking Maps the old-fashioned way with paper and pencil (or pen, crayon or marker…) may provide an extra boost. This is because drawing Thinking Maps by hand activates the kinesthetic system in addition to the visual and semantic systems, providing an additional avenue for encoding. Pencil-and-paper Thinking Maps can be especially beneficial for notetaking and creating study guides. Encourage students to create a hand-drawn “sloppy copy” of their Thinking Map(s) while taking notes from a lecture, video or reading passage. These Maps can be refined later, either by hand or digitally, and turned into other final products such as writing passages. (TMLC subscribers can learn more about notetaking with Thinking Maps in Navigator.)
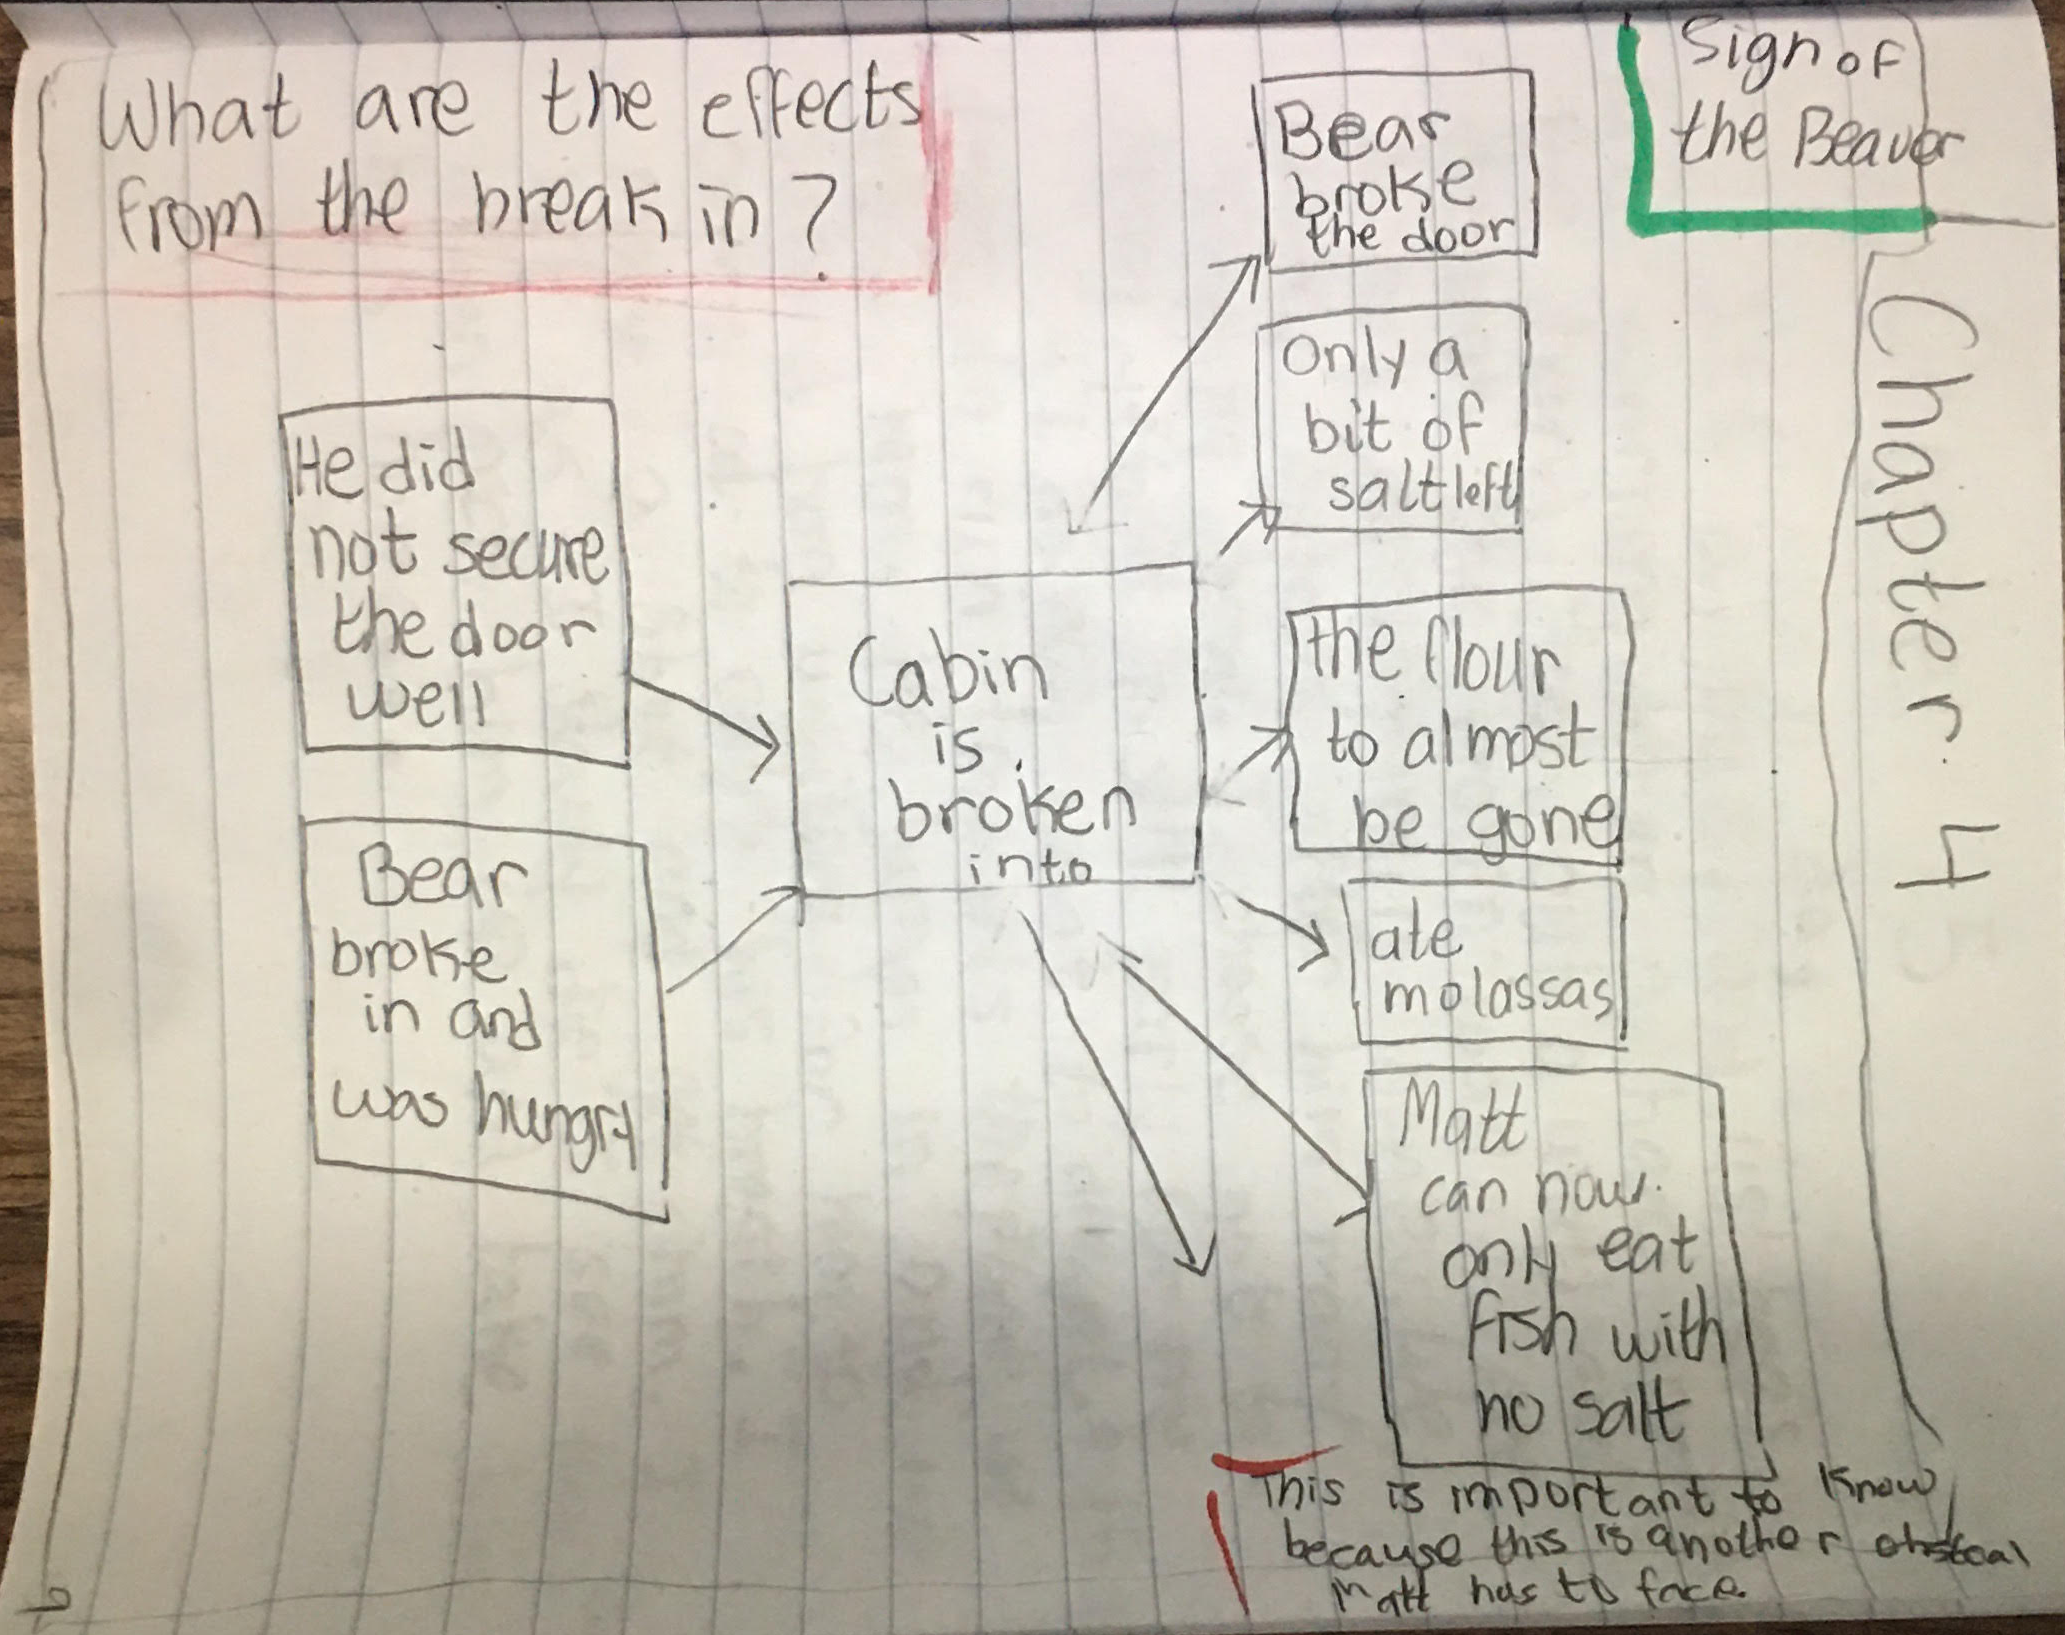
3. Incorporate drawings in your Thinking Maps.
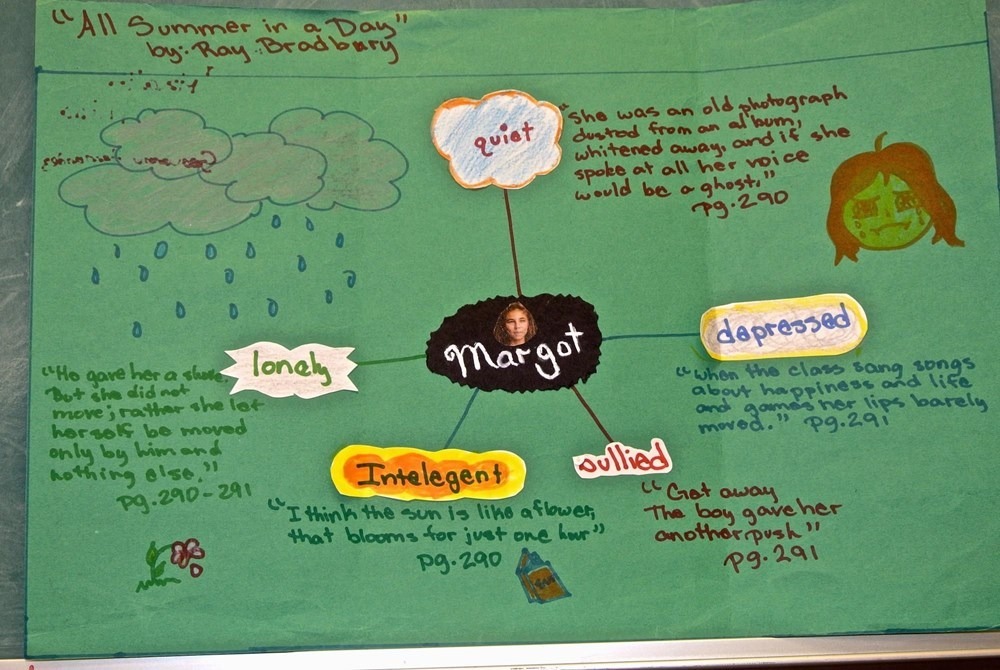
While a Thinking Map is itself a form of drawing, students can also draw pictures right into their Thinking Maps. A Thinking Map can be made with words, images, or both. Using both words and images together activates semantic and visual systems for dual coding.
4. Use color with purpose.
Color is another aspect of drawing that can be used strategically to improve understanding and encoding when creating a Thinking Map. One way color is used in drawing a Thinking Map is in the Frame of Reference, which is used to add context to the Map and encourage reflective thinking. For example, green is used to identify sources of information, blue to identify influencing factors or point of view, and red to state the main idea or conclusions.
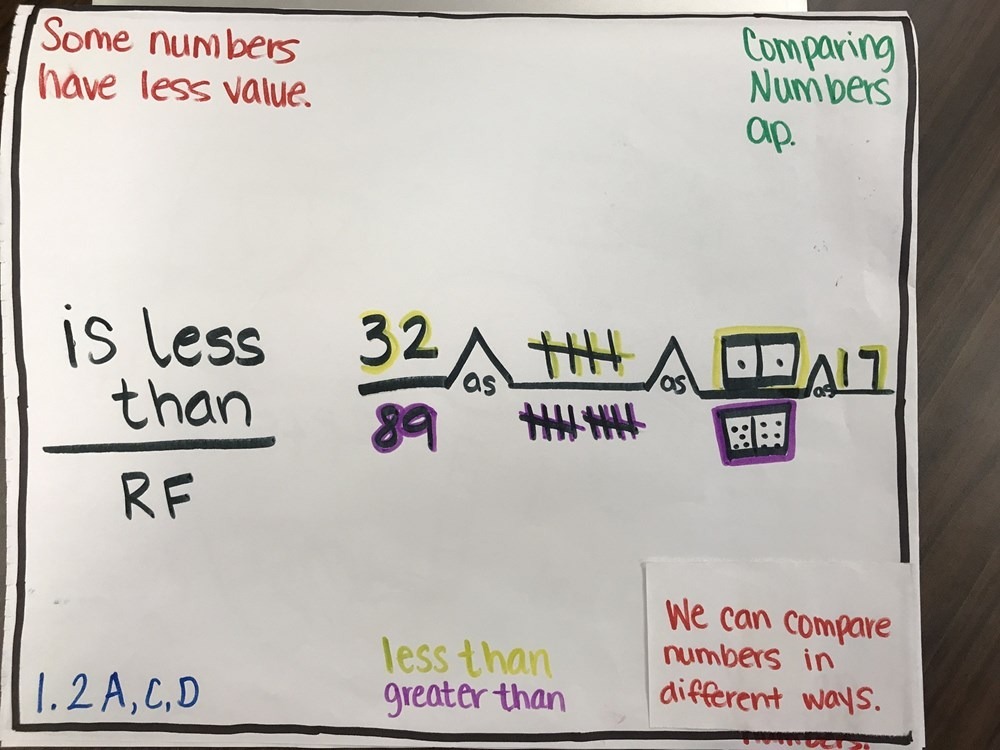
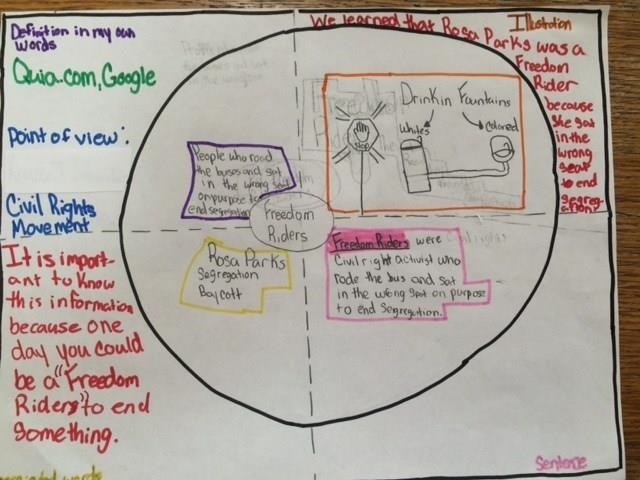
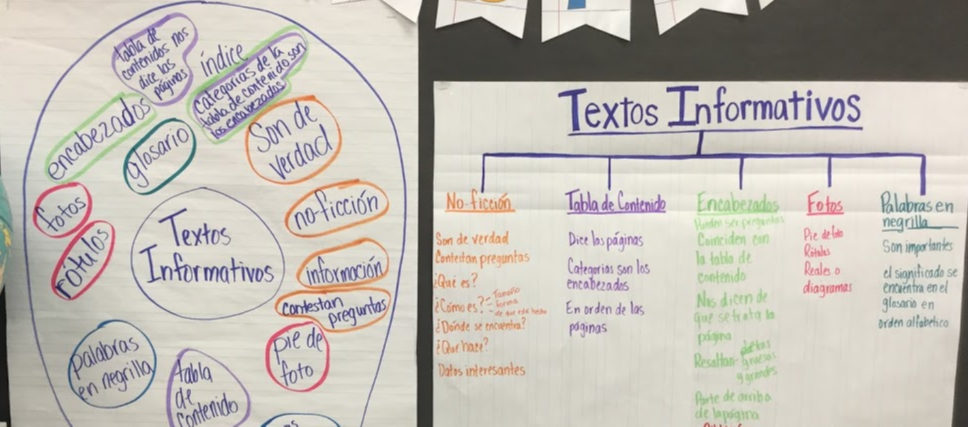
Color can also be used within the main body of the Thinking Map in a variety of ways to further organize information for understanding and recall. In this exercise, students used color to circle different types of text elements in the Circle Map and then categorize them in a Tree Map.
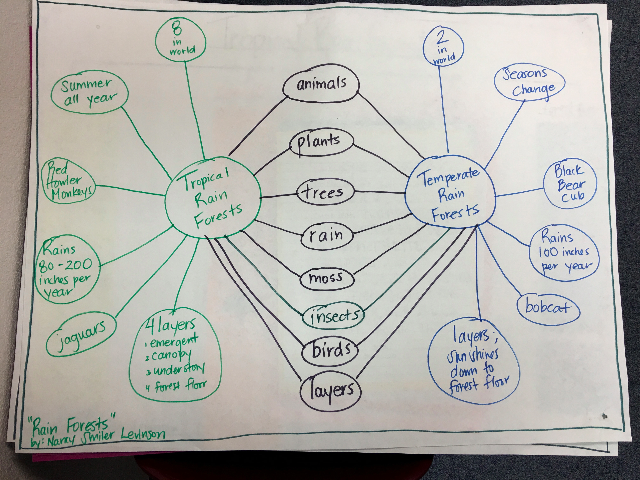
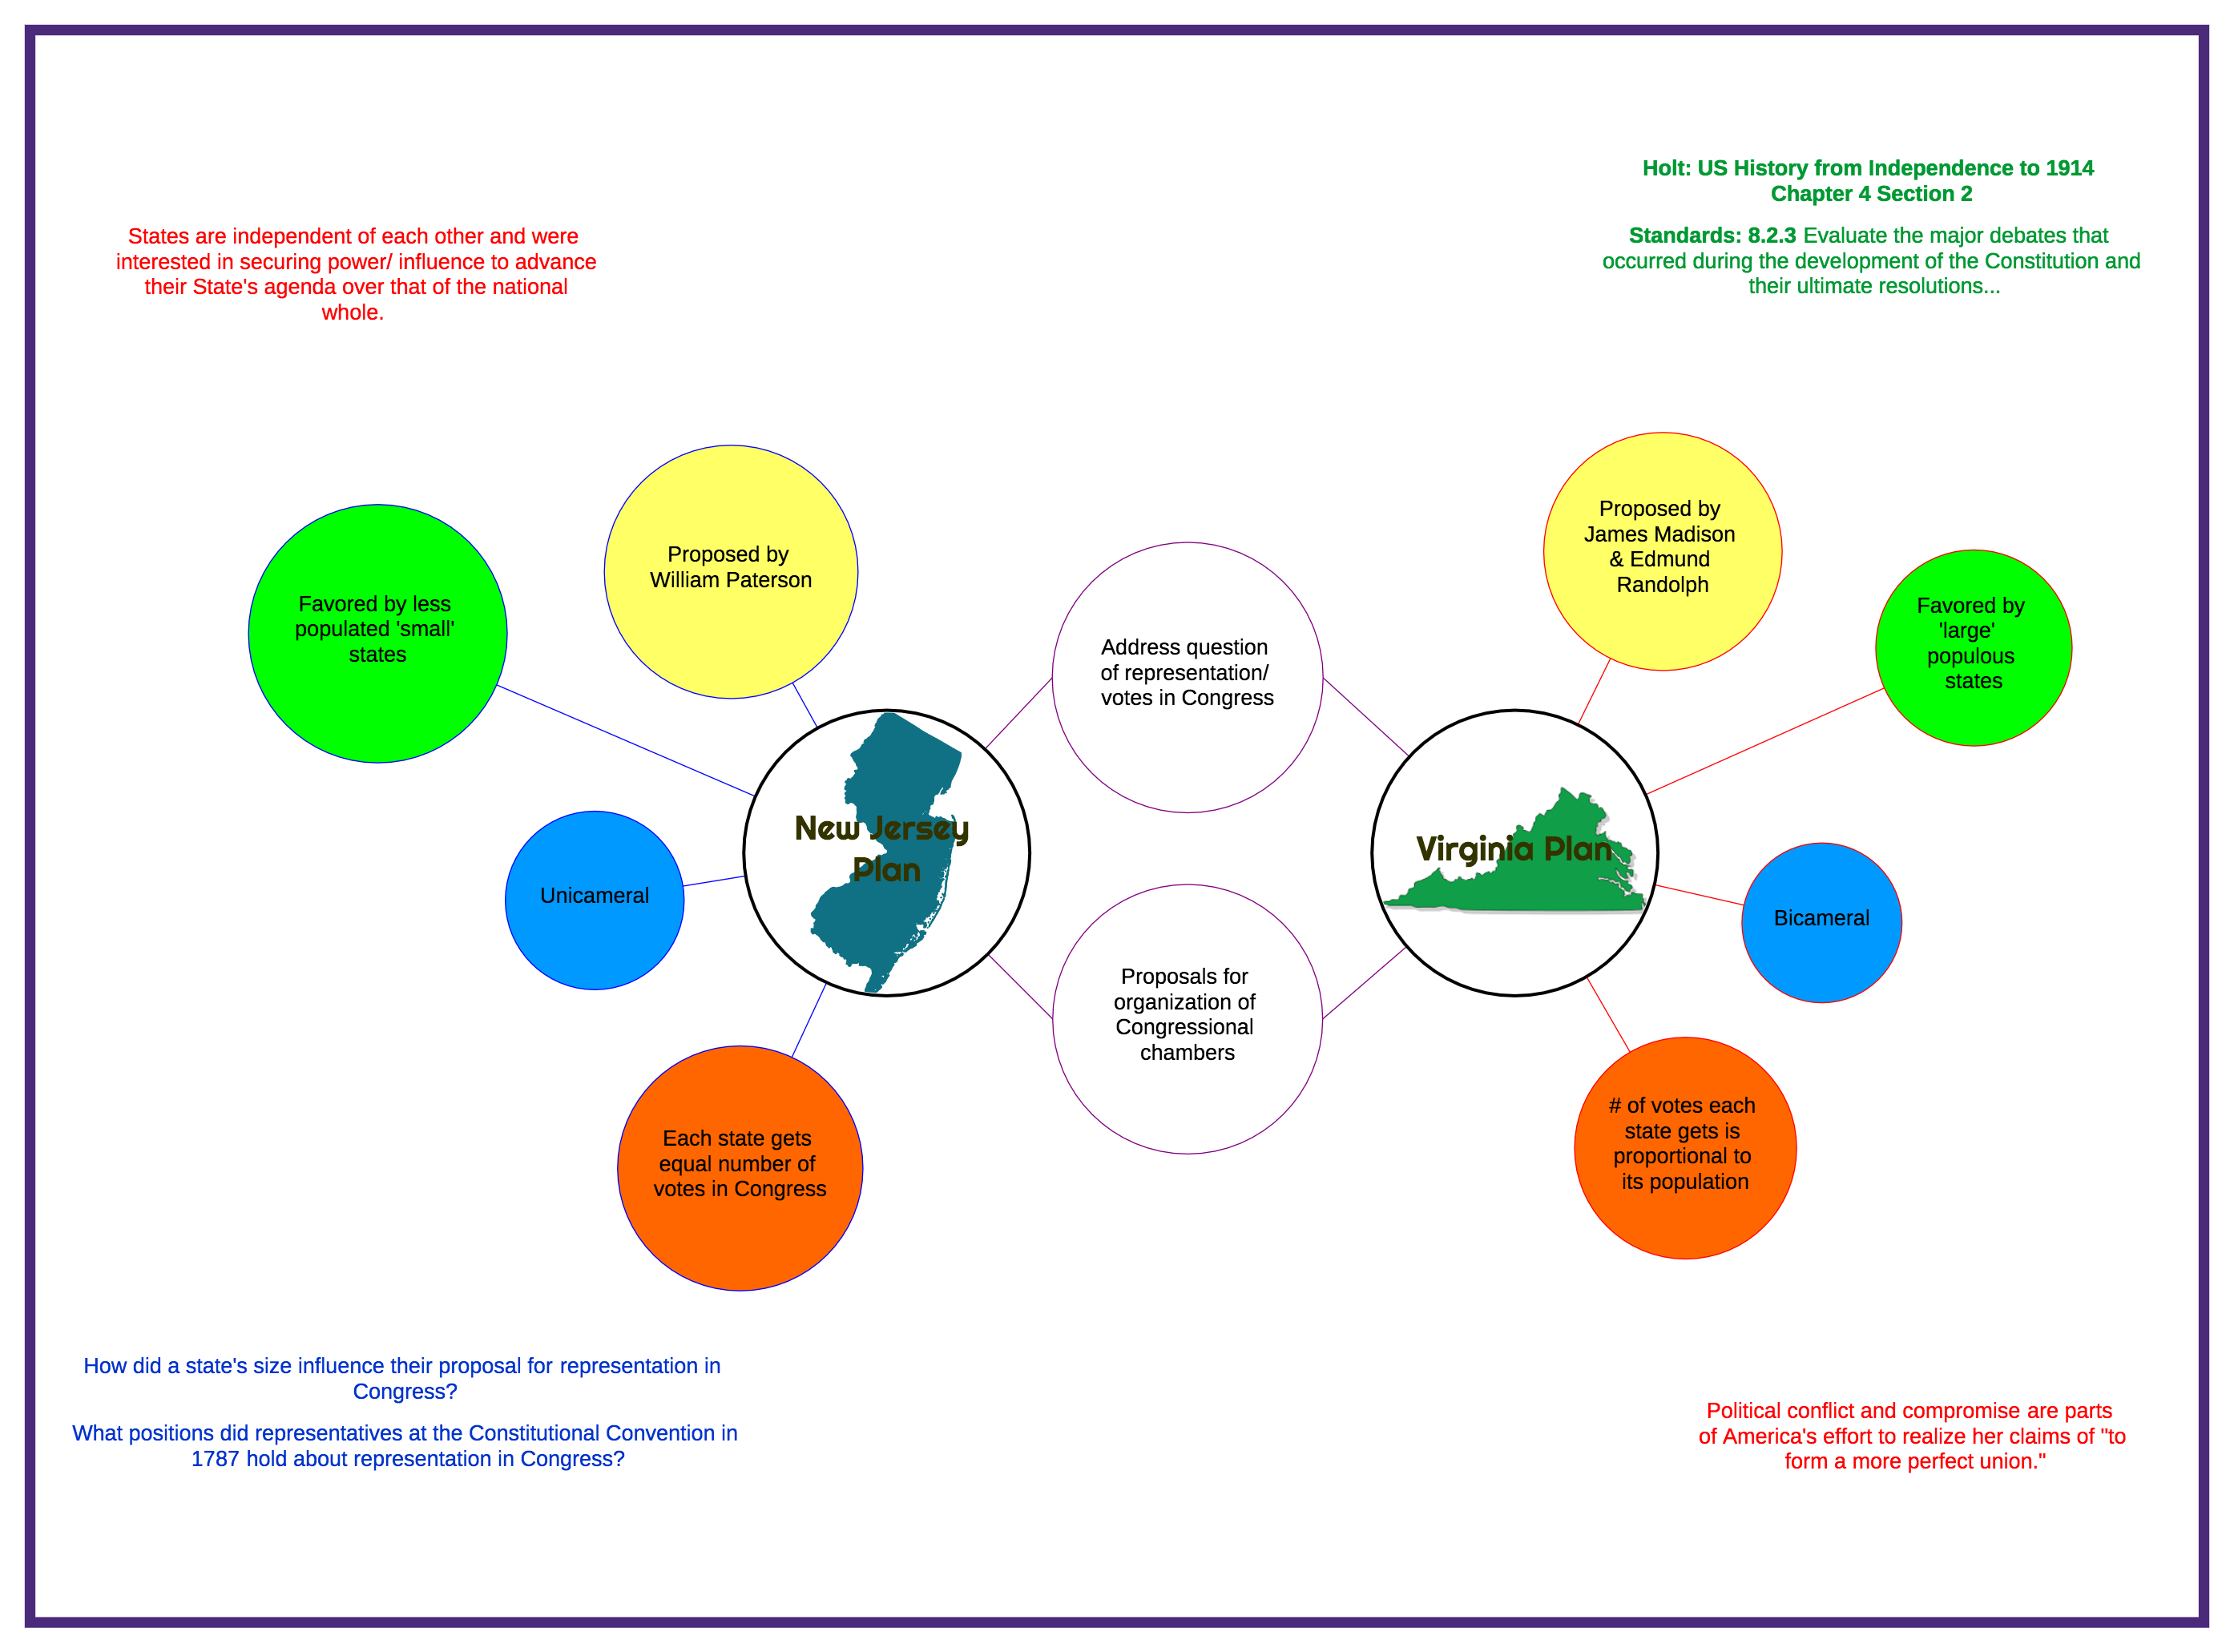
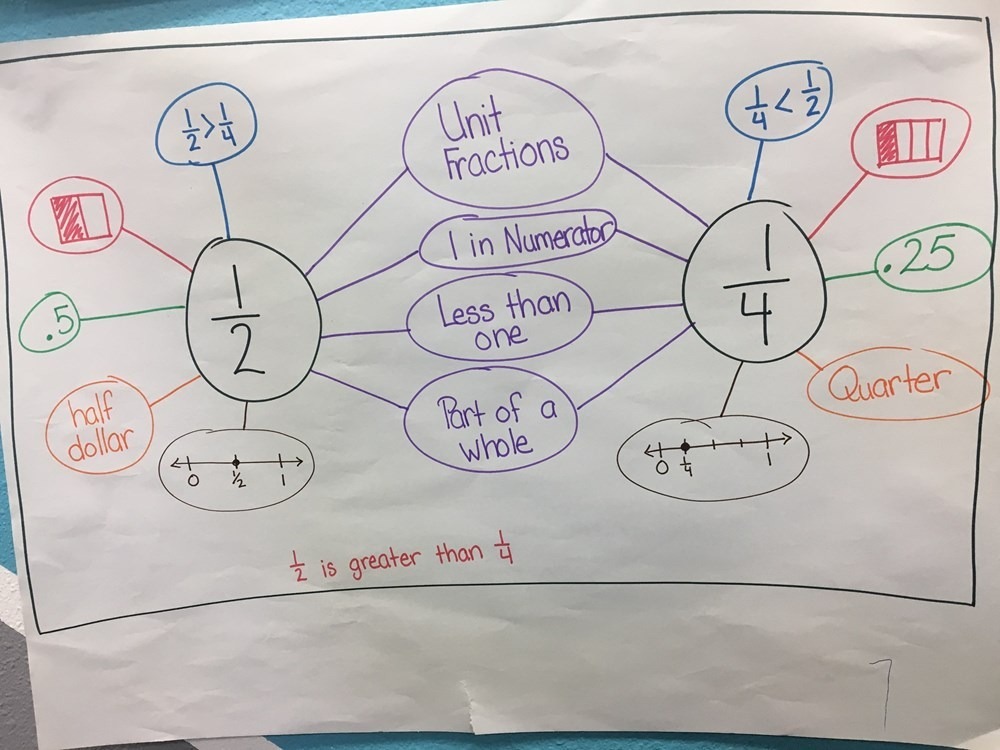
In these Double Bubble Maps, secondary colors are used to show points and counterpoints to connect contrasting ideas together.
Tap Into the Power of Drawing with Thinking Maps
Drawing using Thinking Maps can benefit students of all ages, backgrounds and ability levels. Thinking Maps provide a structure for drawing out relationships between concepts in words, pictures or both. Students don’t need to be great artists to get the learning benefits—they simply need to pick up a pencil or crayon and draw to maximize their learning.
Want to learn how your students can benefit from Thinking Maps? Contact your representative to get started.
Continue Reading
May 1, 2025
Artificial Intelligence (AI) is transforming education, from custom content in a minute to personalized learning. But with this surge in AI adoption comes a critical challenge for educators and students alike—the need to strengthen critical thinking skills. While AI offers immense potential, it cannot replace the human ability to think analytically, question assumptions, and make independent judgments.
March 19, 2025
When we align instruction with the way the brain prefers to receive information, we can reduce the “cognitive load” of learning and help students maximize understanding, retention and recall. These six brain-based strategies can help educators improve learning outcomes and make learning more fun and efficient.
January 15, 2025
Rather than simply memorizing facts, students with strong critical thinking skills learn how to connect ideas, identify patterns, and make informed decisions—key abilities in a rapidly changing world. These higher-order thinking skills at the core of critical thinking push students beyond rote learning to actively engage with content. In fact, closing the critical thinking gap is one of the most effective ways to accelerate learning for students who are struggling to learn grade-level content.
November 15, 2024
Critical thinking is a cornerstone of success in all aspects of life—not only in academics and on the job, but also in personal decision-making, relationships, and citizenship. And yet, critical thinking skills are rarely explicitly taught. Student-directed activities grounded in real-world problems and applications can help students develop the critical thinking skills they need for everyday life.