Thinking Maps vs. Graphic Organizers: What's the Difference?
JUNE 15, 2023
It’s a question we get asked a lot: are Thinking Maps just another type of graphic organizer? If not, what’s the difference? While many people put Thinking Maps in the category of graphic organizers, there are important distinctions in terms of their purpose, use and impact.
Are Thinking Maps a Type of Graphic Organizer?
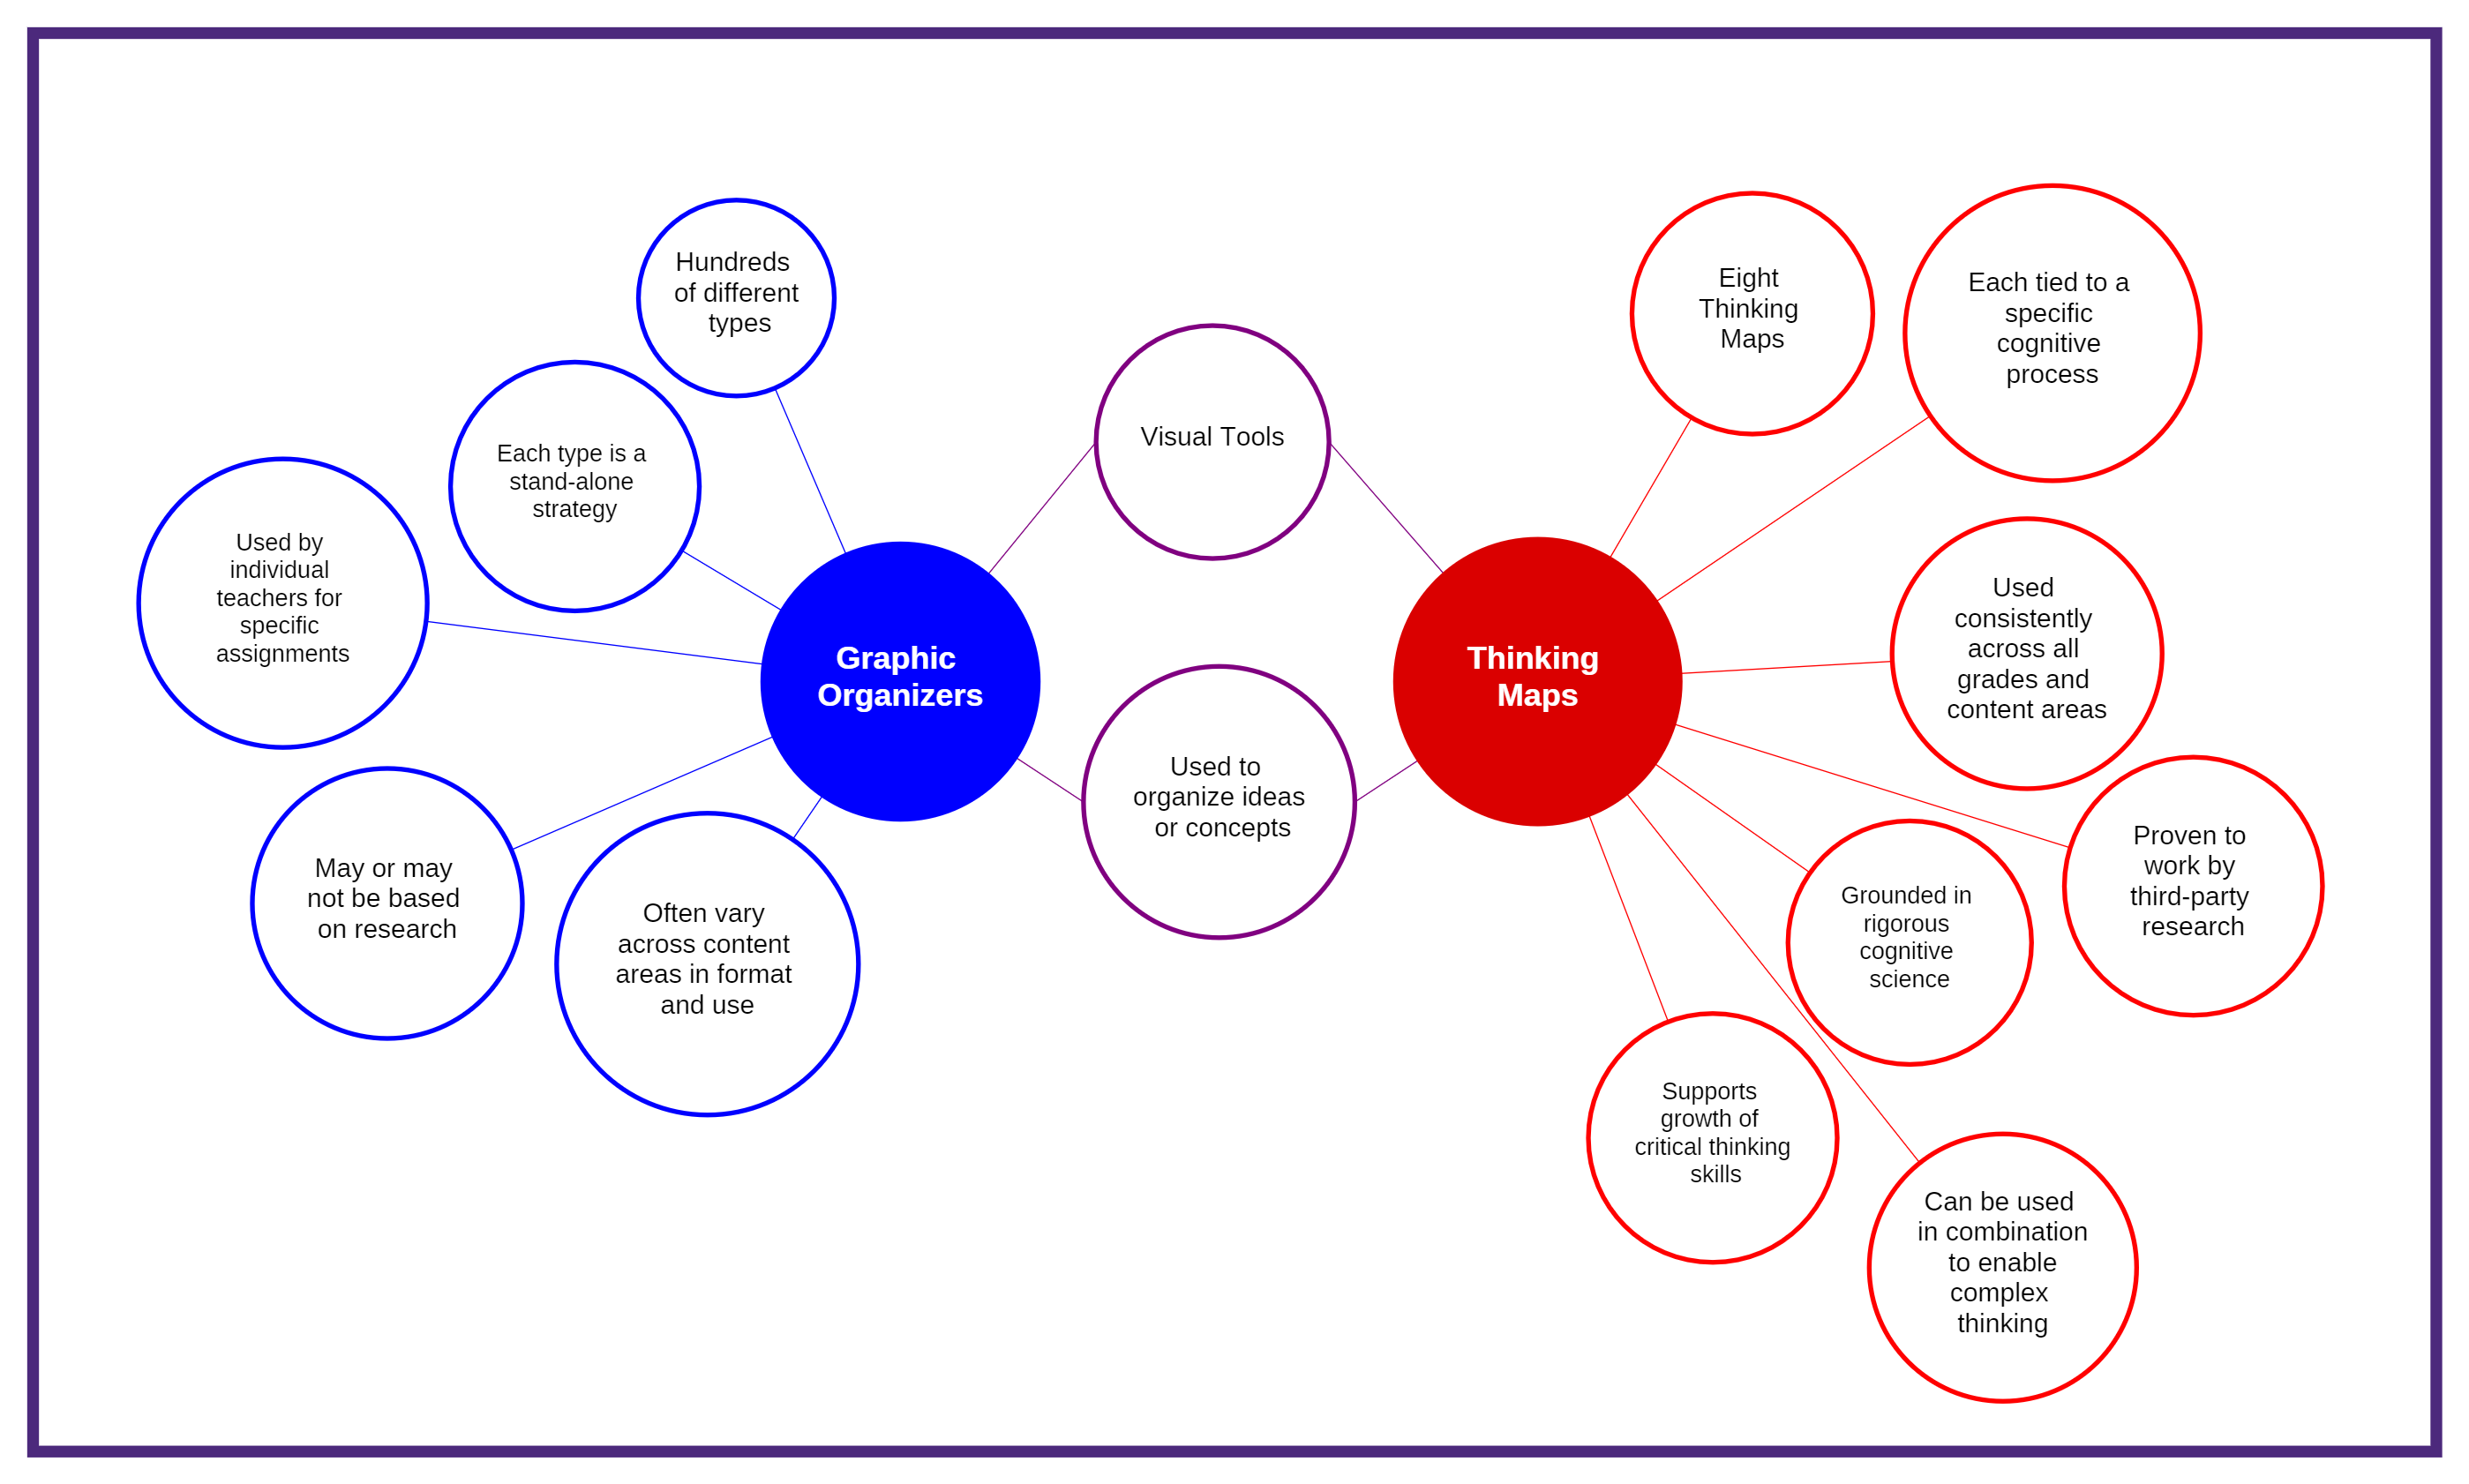
Yes…and no. Both Thinking Maps and graphic organizers present information visually (i.e., graphically). But that is where the similarity ends. While there are dozens of types of graphic organizers for different tasks and purposes, there are just eight Thinking Maps that are used across all content areas, creating a shared visual language for learning. They offer a structured way to process information that is informed by cognitive science. And rather than simply help students complete a task, they are designed to develop critical thinking skills and activate specific cognitive processes. Here are some of the key differences between Thinking Maps and graphic organizers.
Task-Based vs. Thinking-Based
Graphic organizers such as Venn diagrams, T-charts and flowcharts have been used for centuries to help people organize information visually. Most of these have developed organically over time, and publishers love to create new variations. These graphic organizers tend to be highly task-based; some may be specifically designed for a single assignment or purpose.
In contrast, Thinking Maps are rooted in cognitive science and are focused on thinking. Each of the eight Thinking Maps is correlated to a specific cognitive skill. Together, these eight skills underlie all learning. Thinking Maps work the way the brain works to help students retain and recall information, understand and engage with complex ideas, and organize their own thinking. And they have been proven to work by third-party research. Schools who use Thinking Maps consistently are two times more likely to outperform district peers in reading and 2.7 times more likely to outperform district peers in math.
Variation vs. Consistency
KWL charts. Claim-data-warrant. Learning maps. T-charts. Timelines. Hamburger charts. Students may use dozens of different types of graphic organizers over their academic career, some only in a single class or subject. Each time they are faced with a new type of graphic organizer, they must first figure out what is being asked and how they should use it to organize information. This adds to the cognitive load of the assignment.
Thinking Maps are used across all grades and content areas—and that consistency is important. Thinking Maps aren’t just one-off strategies used by a single teacher. They are a shared visual language for learning across the entire school. This builds automaticity for students in using Thinking Maps and, by extension, activating the cognitive processes to which they are aligned. It also saves time for teachers and makes learning more efficient; instead of spending cognitive energy figuring out how to apply a specific graphic organizer, students can immediately start engaging with the actual content. In this way, Thinking Maps become portable, student-owned strategies that students can use independently through their formal academic life and beyond.
Teacher-Directed vs. Student-Directed
Many graphic organizers are available as downloadable worksheets or provided by publishers to go along with a specific piece of content. This may be convenient, but pre-made blank graphic organizers don’t do much to develop critical thinking skills. Instead of learning how to activate the right cognitive process for the task, students learn to simply fill in the boxes.
Thinking Maps, whether analog or digital, are always created from scratch by the student. Instead of being told what type of visual to use or what boxes to fill in, students learn to analyze the task to determine what kind of thinking is required and, therefore, what kind of Thinking Map they should create. For example, signal words such as “compare” indicate that a Double Bubble Map should be used, while words like “explain the impact” would require the use of a Multi-Flow Map. Details such as the number of bubbles, branches or boxes to use are up to the student to determine. This requires students to think critically to analyze the requirements of the task as they create their Thinking Map.
Stand-Alone vs. Integrated
Each type of graphic organizer is generally designed as a stand-alone task. You wouldn’t typically tell students to use both a Venn diagram and a T-chart together, for example. Each of these graphic organizers is used for a specific purpose.
Thinking Maps, however, are even more powerful when they are used in combination. As students build proficiency with the Maps, they learn how to use them together to engage with complex ideas in sophisticated ways. For example, a multi-Map assignment might start with a Circle Map to brainstorm ideas or build background knowledge, move to a series of Multi-Flow Maps to predict the effects of various proposed courses of action, and finally to a Flow Map to plan the steps in a process. Students learn to use the eight Thinking Maps alone and in combination to build cognitive flexibility, complete complex multi-part tasks, and support deep comprehension.
Building Critical Thinking Skills with Thinking Maps
When deciding between graphic organizers and Thinking Maps, consider the ultimate goal: is it simply to have students complete a task, or is it to equip them with a versatile toolkit for higher-order thinking? While traditional graphic organizers can be used to organize information and visualize relationships, Thinking Maps elevate this process by grounding each Map in a specific cognitive skill. This approach aligns more closely with the ultimate aim of education: fostering not just rote learning but the development of critical thinking skills.
Ready to build critical thinking skills at your school? Talk to a Thinking Maps representative to get started.
Continue Reading
May 5, 2026
Thinking Maps is moving to a Training of Coaches (TOC) model because sustained change requires sustained support, and coaching is what makes that possible.
April 23, 2026
Learn how scientific discourse and asking the right questions are the key to scientific understanding. Thinking Maps can help you facilitate the level of scientific discourses needed to critically think across multiple topics within the discipline.
March 25, 2026
Learn how district leaders can evaluate EdTech tools and curriculum against the science of reading and cognitive development research — with 5 key criteria for alignment.
January 29, 2026
If you haven’t explored the TMLC AI Planning Tool, it’s certainly never too late and it’s actually now better than ever. Supercharged with more speed and accuracy so that you get the best of evolving technology, our AI Planning Tool is ready to empower your planning standards and best practices aligned plans that incorporate Thinking Maps.